Welcome to the third post in my series, focused on providing a set of revision notes for the MB-400: Microsoft Power Apps + Dynamics 365 Developer exam. In last week’s post, we took a massive deep dive into some of the core customisation topics that you need to have a good grasp of when tackling the exam. This week, we’ll be taking a look at the equally huge topic area Create and Configure Power Apps, which measures the following skill areas:
Create model-driven apps
- configure a model-driven app
- configure forms
- configure views
- configure visualizations
Create Canvas Apps
- configure a Canvas App
- develop complex expressions
Although this area has reduced weighting compared to last week’s topic (10-15%), you will nevertheless need to have a good understanding of both flavours of Power Apps and their core differences. The focus of today’s post is on working with model-driven apps, specifically; next week’s post will dive deeper into working with canvas apps.
As with all posts in this series, the aim is to provide a broad outline of the core areas to keep in mind when tackling the exam, linked to appropriate resources for more focused study. Your revision should, ideally, involve a high degree of hands-on testing and familiarity in working with the platform if you want to do well in this exam.
With the intro out of the way now, let’s dive straight in and take a look at model-driven apps.
Model-Driven Apps
Longstanding Dynamics 365 developers will be most familiar with the model-driven app experience, as it’s virtually identical to the inherited user experience previously provided by Dynamics CRM. Targeted towards data-driven applications, that feed directly off the Common Data Service (CDS), they offer a modern approach to creating a bespoke, targeted business application, that exposes the most useful components necessary for a user to complete their job. With a model-driven app, developers can bundle together the following components:
- Site Map: Whereas previously, developers would have to use the XrmToolBox Sitemap Editor to perform sitemap amends, we can now fully customise the sitemap within the application, using a drag and drop interface. And, unlike previous versions of Dynamics 365, multiple sitemaps can exist and scoped to a single model-driven app. This enhanced experience provides us with the capability to have bespoke sitemaps for every model-driven app deployed to a Dynamics 365 / CDS instance. To find out more about this new SiteMap customisation experience, the following tutorial article on the Microsoft Docs website shows you how to work with this feature in-depth.
- Dashboards: It is possible to configure one or several different dashboards that will display for a user when they first load a model-driven app.
- Business Process Flows: Like Dashboards, we can select one, none or several different Business Process Flows that users will have access to within the app.
- Entities: Developers can select as many or as few entities to expose within an app. Then, at a more granular level, it is possible to choose specific components from the following categories:
- Forms
- Views
- Charts
- Dashboards
Also, you can configure model-driven apps with the following top-level properties:
- Name
- Description
- Icon: Developers can use a default icon or upload a new image for the app, that will render when the user is selecting the app from the explorer bar.
- Welcome Page: If required, an HTML Web Resource document can be uploaded as a welcome page to users when they first launch the app.
- Enable Mobile Offline: You can enable model-driven apps for offline use by selecting an appropriate Mobile Offline Profile.
The screenshot below shows an example of how the default Sales Hub model-driven app looks when deployed out:
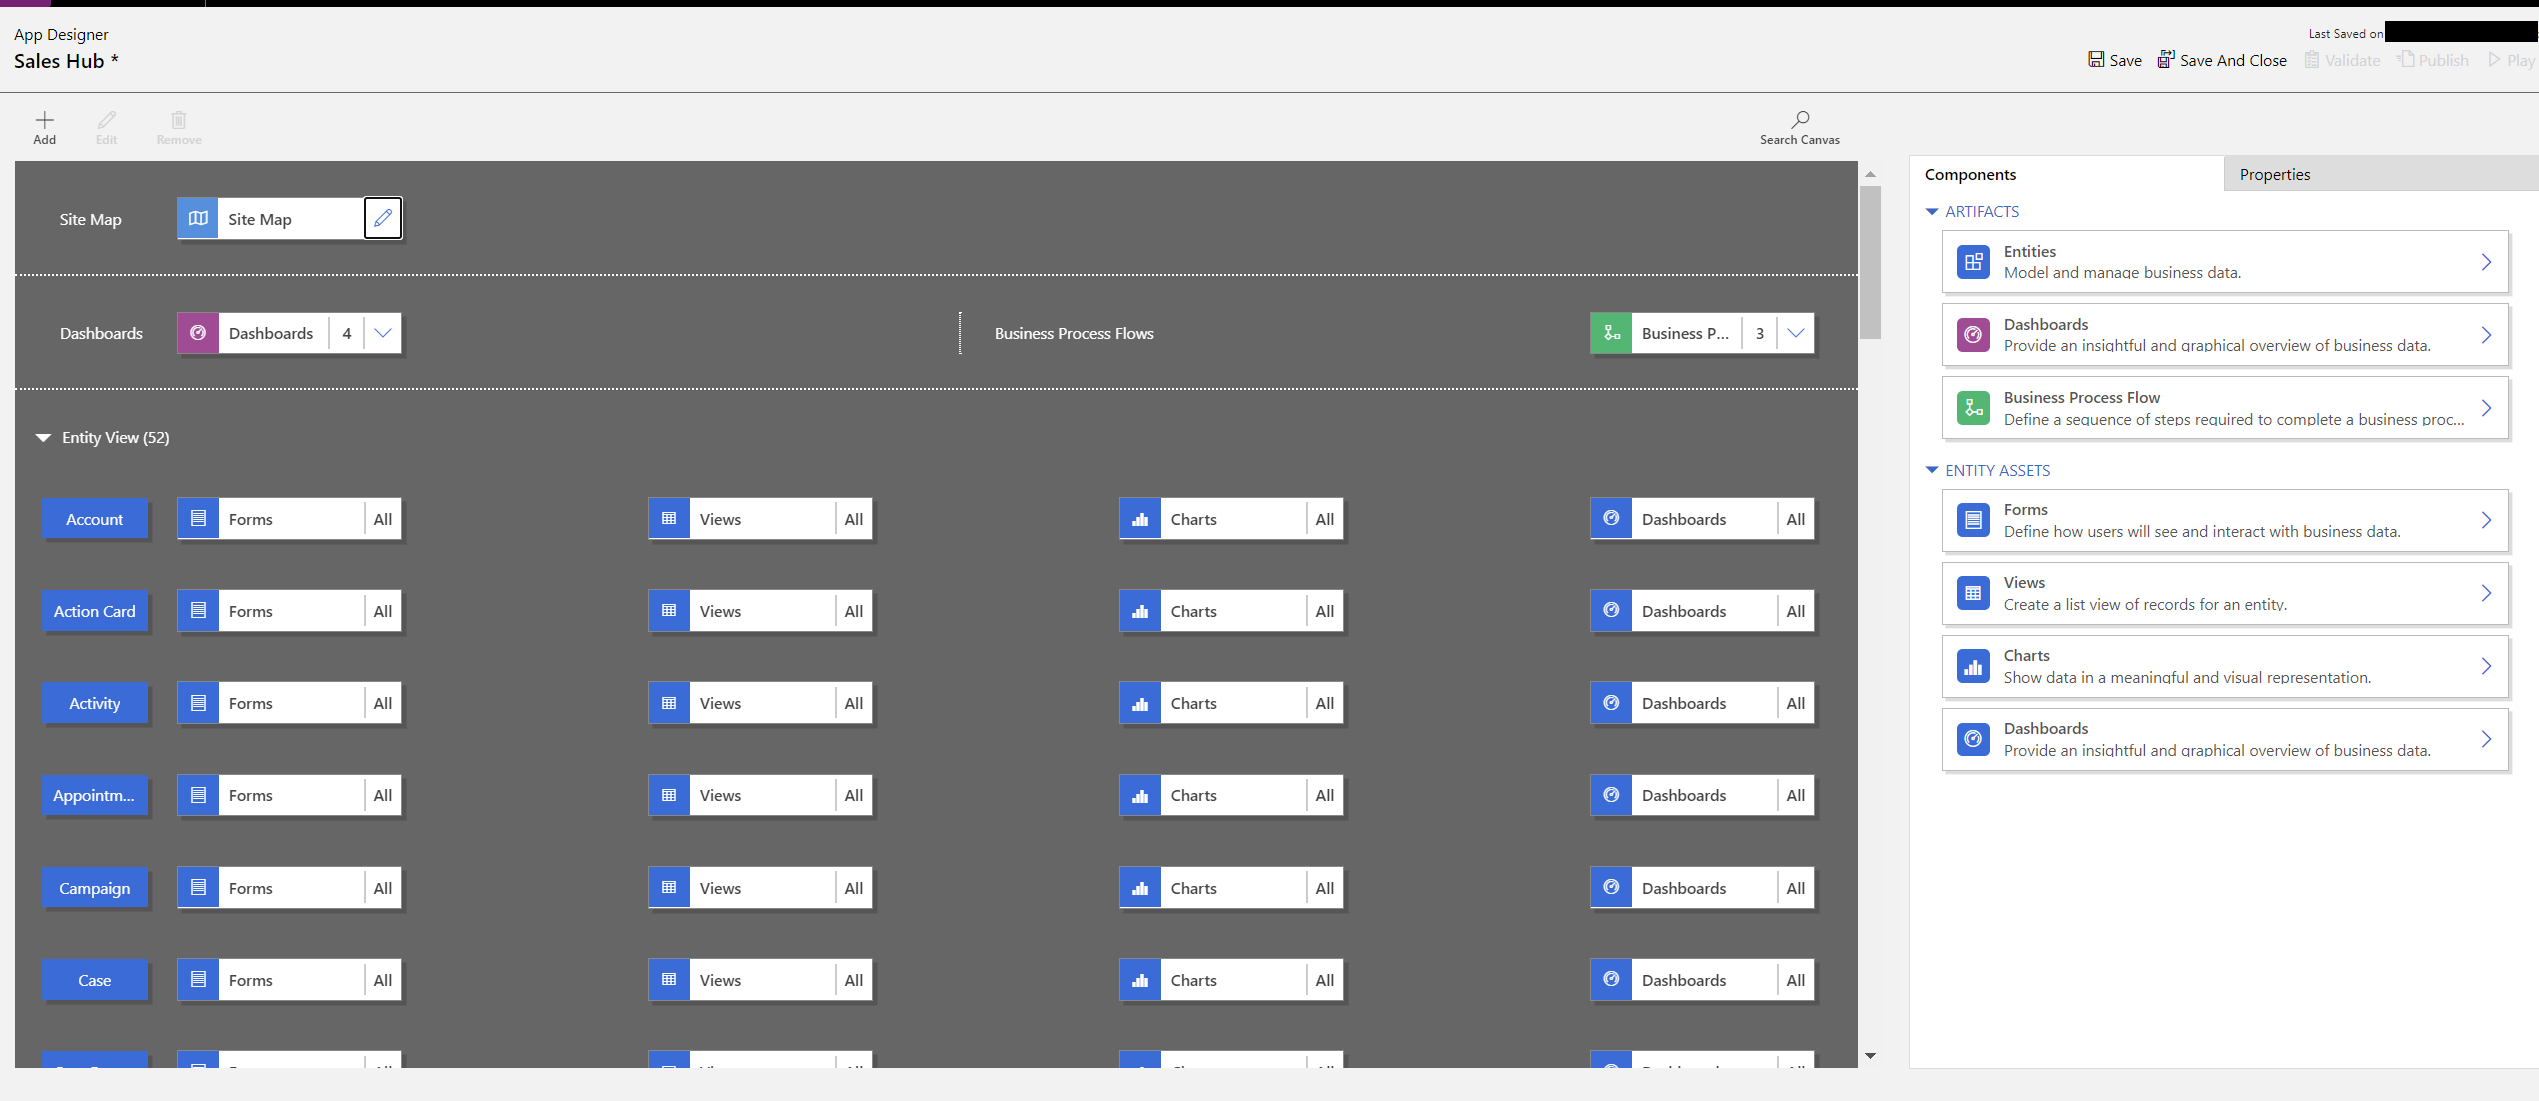
Typically, model-driven apps are best suited for back-office situations, when users are working off a fixed PC/laptop or have a need to interact with CDS data directly. However, the new unified interface (UI) provides a mobile responsive template that works effectively across any device type.
Merely setting up a model-driven app or deploying one out will not be sufficient for ensuring that users can access it correctly. As outlined in this article, it will be necessary to not only grant security role access to all Entities within the app but also to the app itself.
As part of your development cycle for a model-driven app, the process of building the app would probably be last in your order of priority. First, after ensuring you have customised your required entities appropriately, you would proceed next to building out the forms, views, charts and dashboards for the entity. Let’s take a look now at how to do this from within the App Designer.
Working with Forms
Forms are the layer that exposes data for access and modification within a model-driven application. As customisers, we can create four types of forms for each entity:
- Main: These are the standard forms that will be exposed via the web interface and also via the mobile Dynamics 365 app, with some limitations. They are also the most common type of forms to work with.
- Quick Create: It is sometimes desirable to allow users to quickly add new records to the system, without having to necessarily drill-down first into the entity in question. Quick Create forms meet this objective, by allowing users to select the + icon at the top of a model-driven app that then loads a specialised, condensed form, containing only the values that you need to specify on record creation. The example below shows how the Contact Quick Create form renders inside a model-driven app:
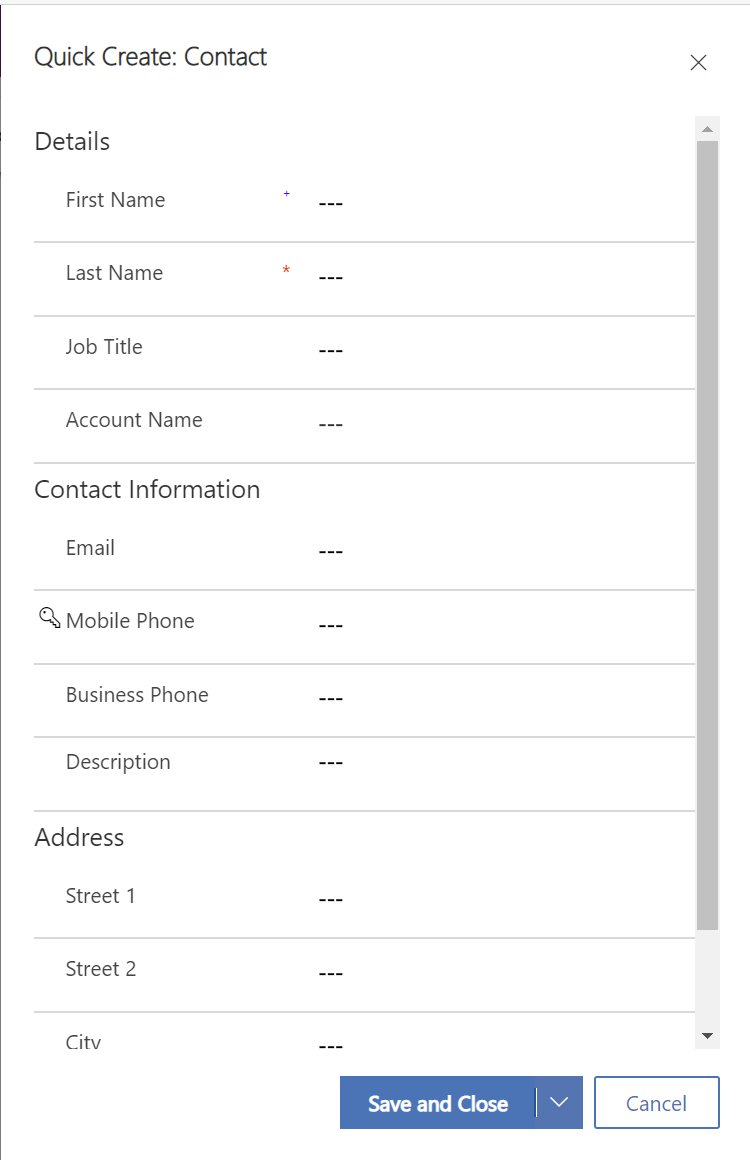
- Quick Create forms do have several limitations, though. For example, you cannot assign them to particular security roles to curtail access to them, and you can’t customise their Headers or Footers. They do, however, support the ability to add on custom event handlers via JScript form functions or Business Rules.
- Quick View: For situations where you need to expose several information points from a related entity, Quick View forms are the best tool to use. They allow you to specify and arrange several fields from an entity into a read-only control, that you can then add onto a related entity form as a reference point. Provided that the related entity’s lookup control has a valid value, the information will then load through; otherwise, the Quick View form will not render. Quick View forms have the same limitations as Quick Create forms and, because they present a read-only view, do not support custom event handlers or Business Rules.
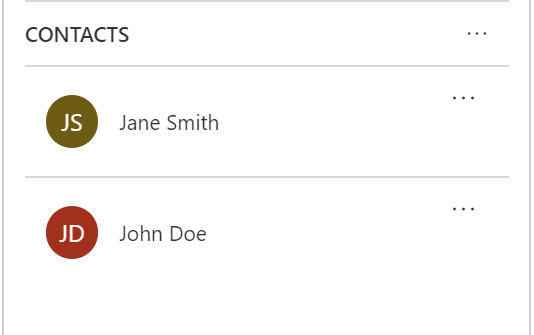
- Card: A new feature for unified interface model-driven apps, these form types work in the same manner as Quick View forms, but are instead explicitly optimised for viewing within a mobile device. However, unlike Quick View forms, they are instead added to an existing subgrid form as a custom control. For example, in the screenshot below from the Account form editor, we can see that I’ve added the Contact Card form onto the Contact subgrid:
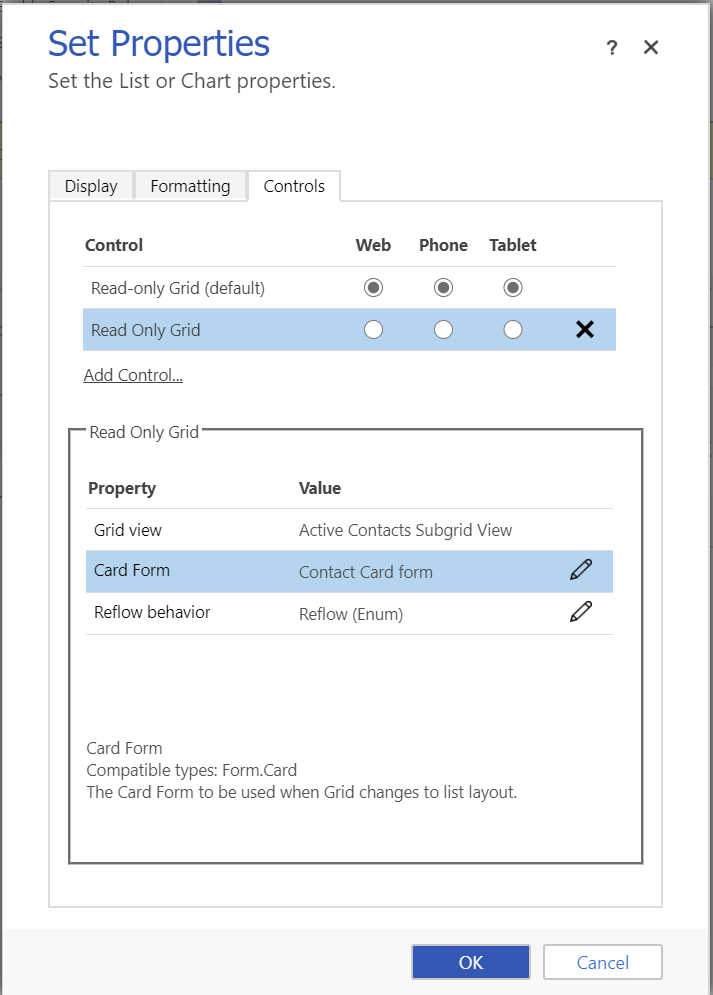
- This control will then render as follows within a UI model-driven app:
To find out more about the different form types available, and how to work with them, the following Microsoft Docs article goes into great detail on this entire subject.
There are no restrictions over the number of forms we can define for an entity. Still, it is generally best practice to build forms to meet specific business areas and then distribute these out for access via a security role. However, take note that you must always have at least one main form for an entity defined as the fallback form, without any security role privileges associated with it. This step ensures that a user always has access to at least one form so that you do not impede them when they’re working with an entity.
The actual process of working and modifying forms will, in most cases, take place within the recently released Power Apps form designer, as indicated below:
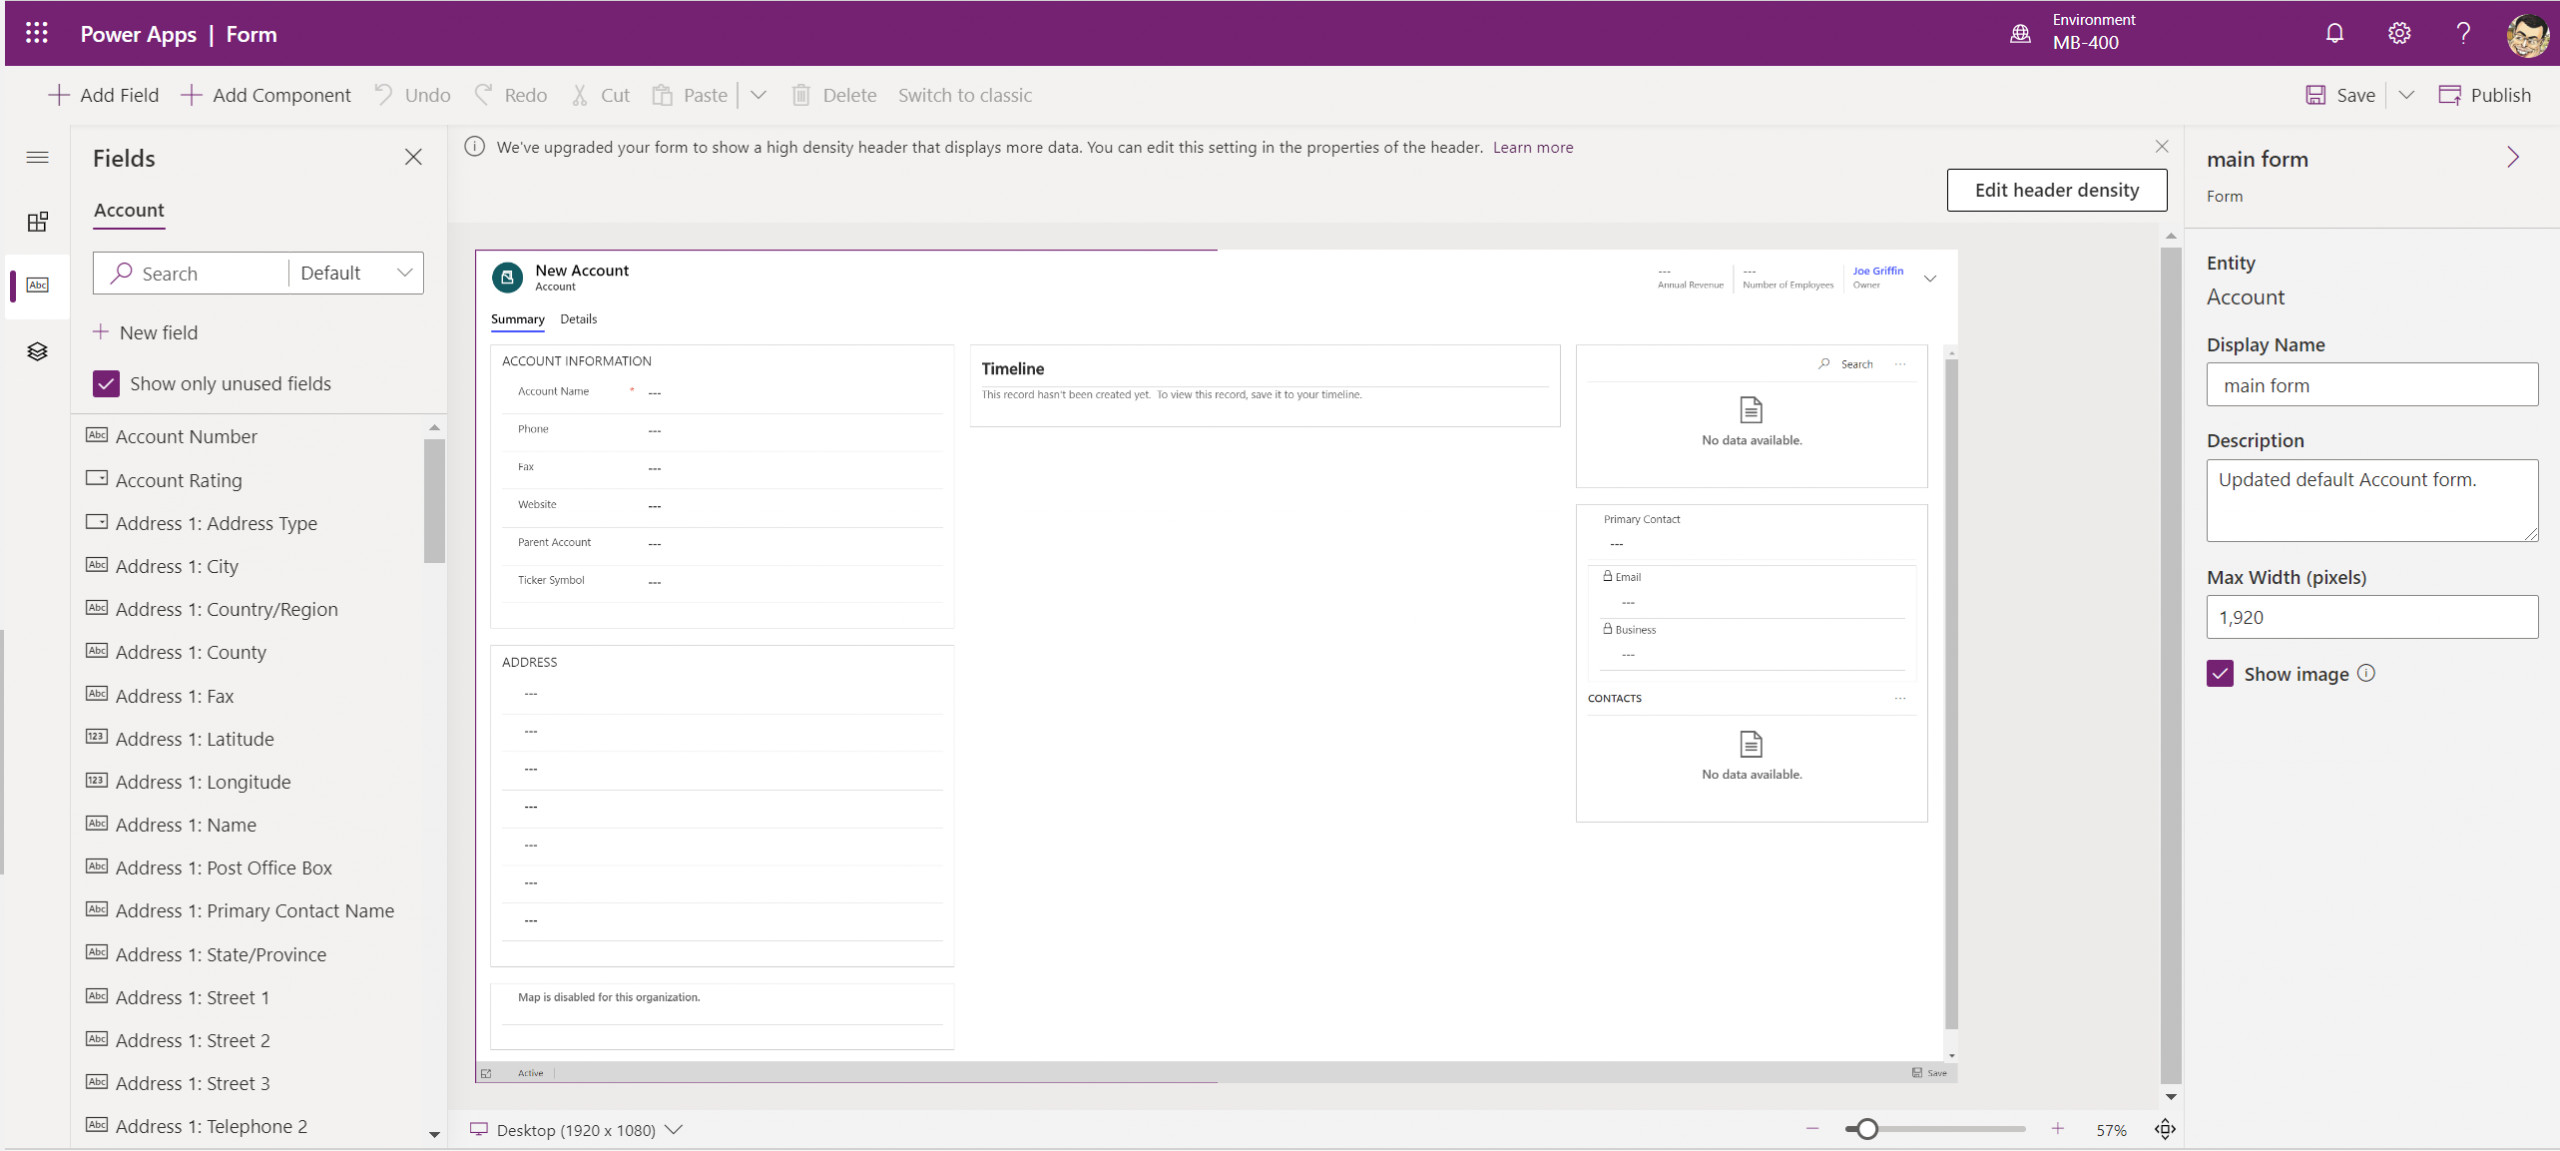
This modern experience provides numerous benefits over the traditional, classic designer, primarily in:
- Surfacing a “what you see is what you get” editor, allowing you to drag around, re-size and manipulate around components and instantly see how your changes will look across multiple devices.
- Simplifying the process of adding new fields and components onto a form.
- Allowing form customisers to quickly “cut and paste” components or fields to new locations on the form.
Developers can still customise forms using the classic editor if required. This step will be necessary if you are trying to achieve any of the following tasks:
- Associate a Web Resources to a form or setup JScript event handlers.
- Insert specialised controls to a form, such as Web Resources, IFrames, Bing Maps etc.
- Configure any setting relating to the presentation or user experience within the classic interface.
However, wherever possible, you should ensure that you use the new form editor experience as, over time, Microsoft may choose to remove the classic form editor.
From a developers perspective, you will typically work with forms in several different contexts:
- When defining and associating a Business Rule to a form.
- In adding and tailoring event handlers for any custom form functions, which you would typically author in JScript or TypeScript.
- For when you need to bind a Power Apps Component Framework (PCF) control to a field or sub-grid.
- When rendering custom content via an IFrame or Web Resource.
Therefore, having a good awareness of the various properties available as part of the classic form editor (for now at least) will be crucial concerning the exam.
Form customisation is a broad topic, that can take some time to understand fully. Be sure to fully read through the series of Microsoft Docs related to the new form designer, as well as gaining a full understanding of the classic form editor too.
Creating Views
Views are the primary mechanism through which multiple records are…well…viewed and interacted with as part of a model-driven application. Similar to forms, an entity can have numerous types of views defined for it and, as customisers, we can set up as many different types of Public Views that we would like for an entity. It is also worth noting that there are several other view types, all of which are created by default when an entity is first created and can be modified further if required:
- Advanced Find View: This defines the columns and sorting behaviour of data that is returned by default (i.e. if the user does not override any of these settings) via an Advanced Find search
- Associated View: When rendering records from a related entity on a form, the application uses this view by default.
- Lookup View: The Lookup View appears whenever you search for records within a lookup field or control.
- Quick Find View: This is the default view that appears when searching for a record using the applications Quick Find functionality. Any column within this view that the system or yourself defines as a Find column will also, I believe, be indexed within the database, thereby leading to faster searches when querying this field.
Primarily, you will want to use the new view designer when working with views, which I’ve illustrated an example of in the screenshot below:
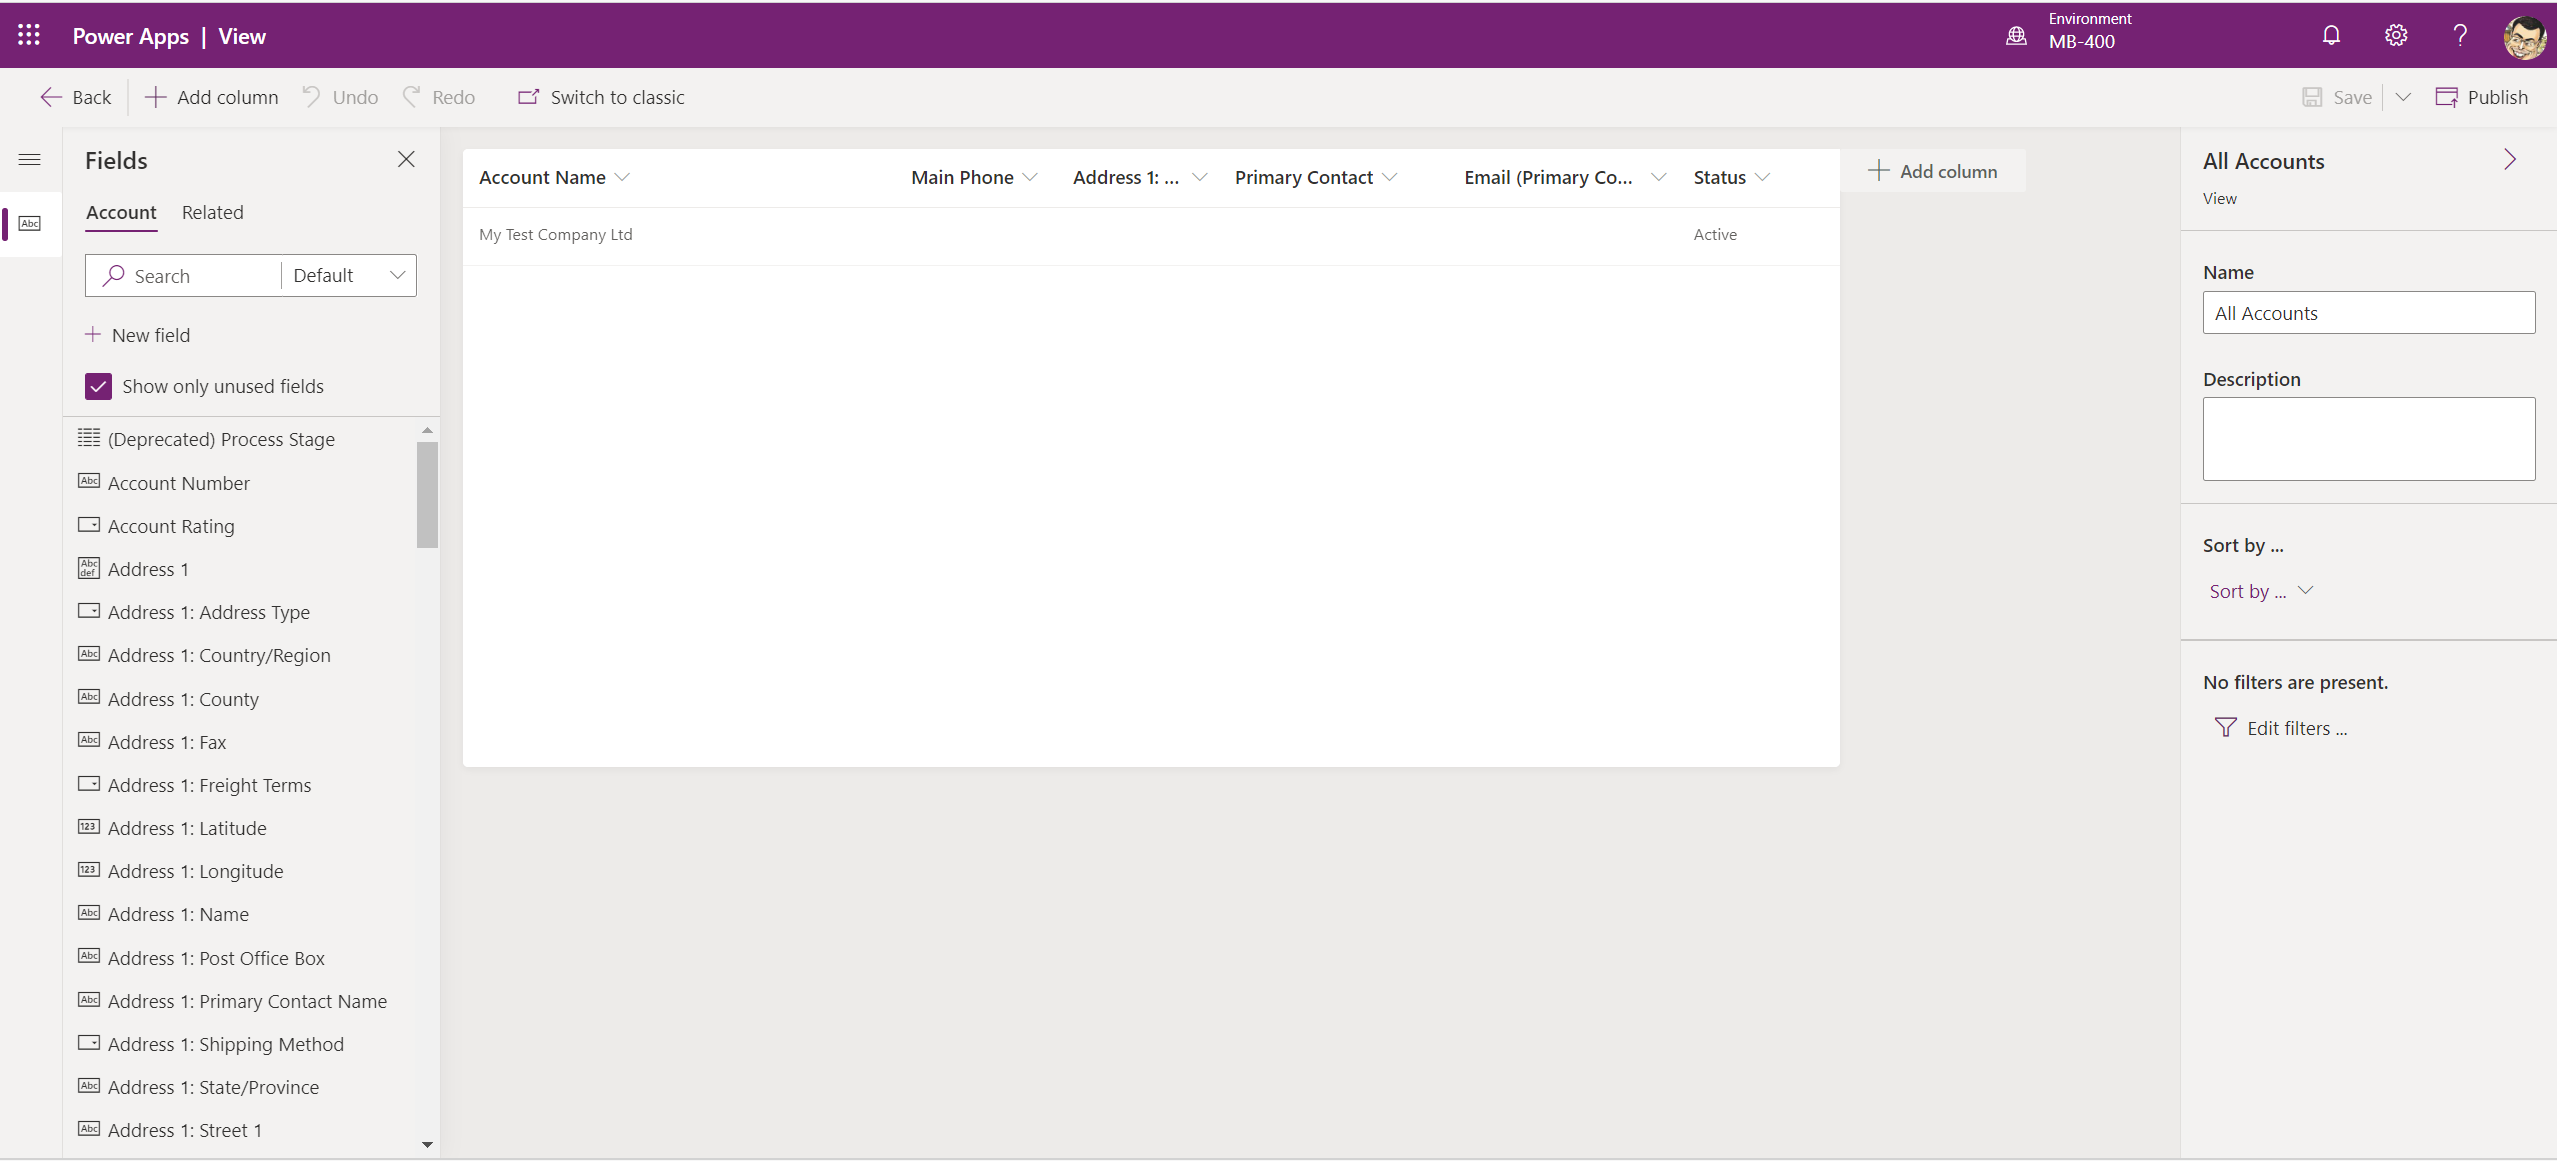
Within the view designer, you can:
- Add on any column from the primary or parent, related entity (e.g. add on the name of the Primary Contact from the linked Account record)
- Adjust the width of a column and its placement within the view.
- Define as many sortation rules as required for any data returned via the view.
- Build out the required list of filters to apply to the data before the application returns it to the end-user.
- Modify the name and description of the view.
However, there may be situations where you have to revert to the classic view editor, which looks like this:
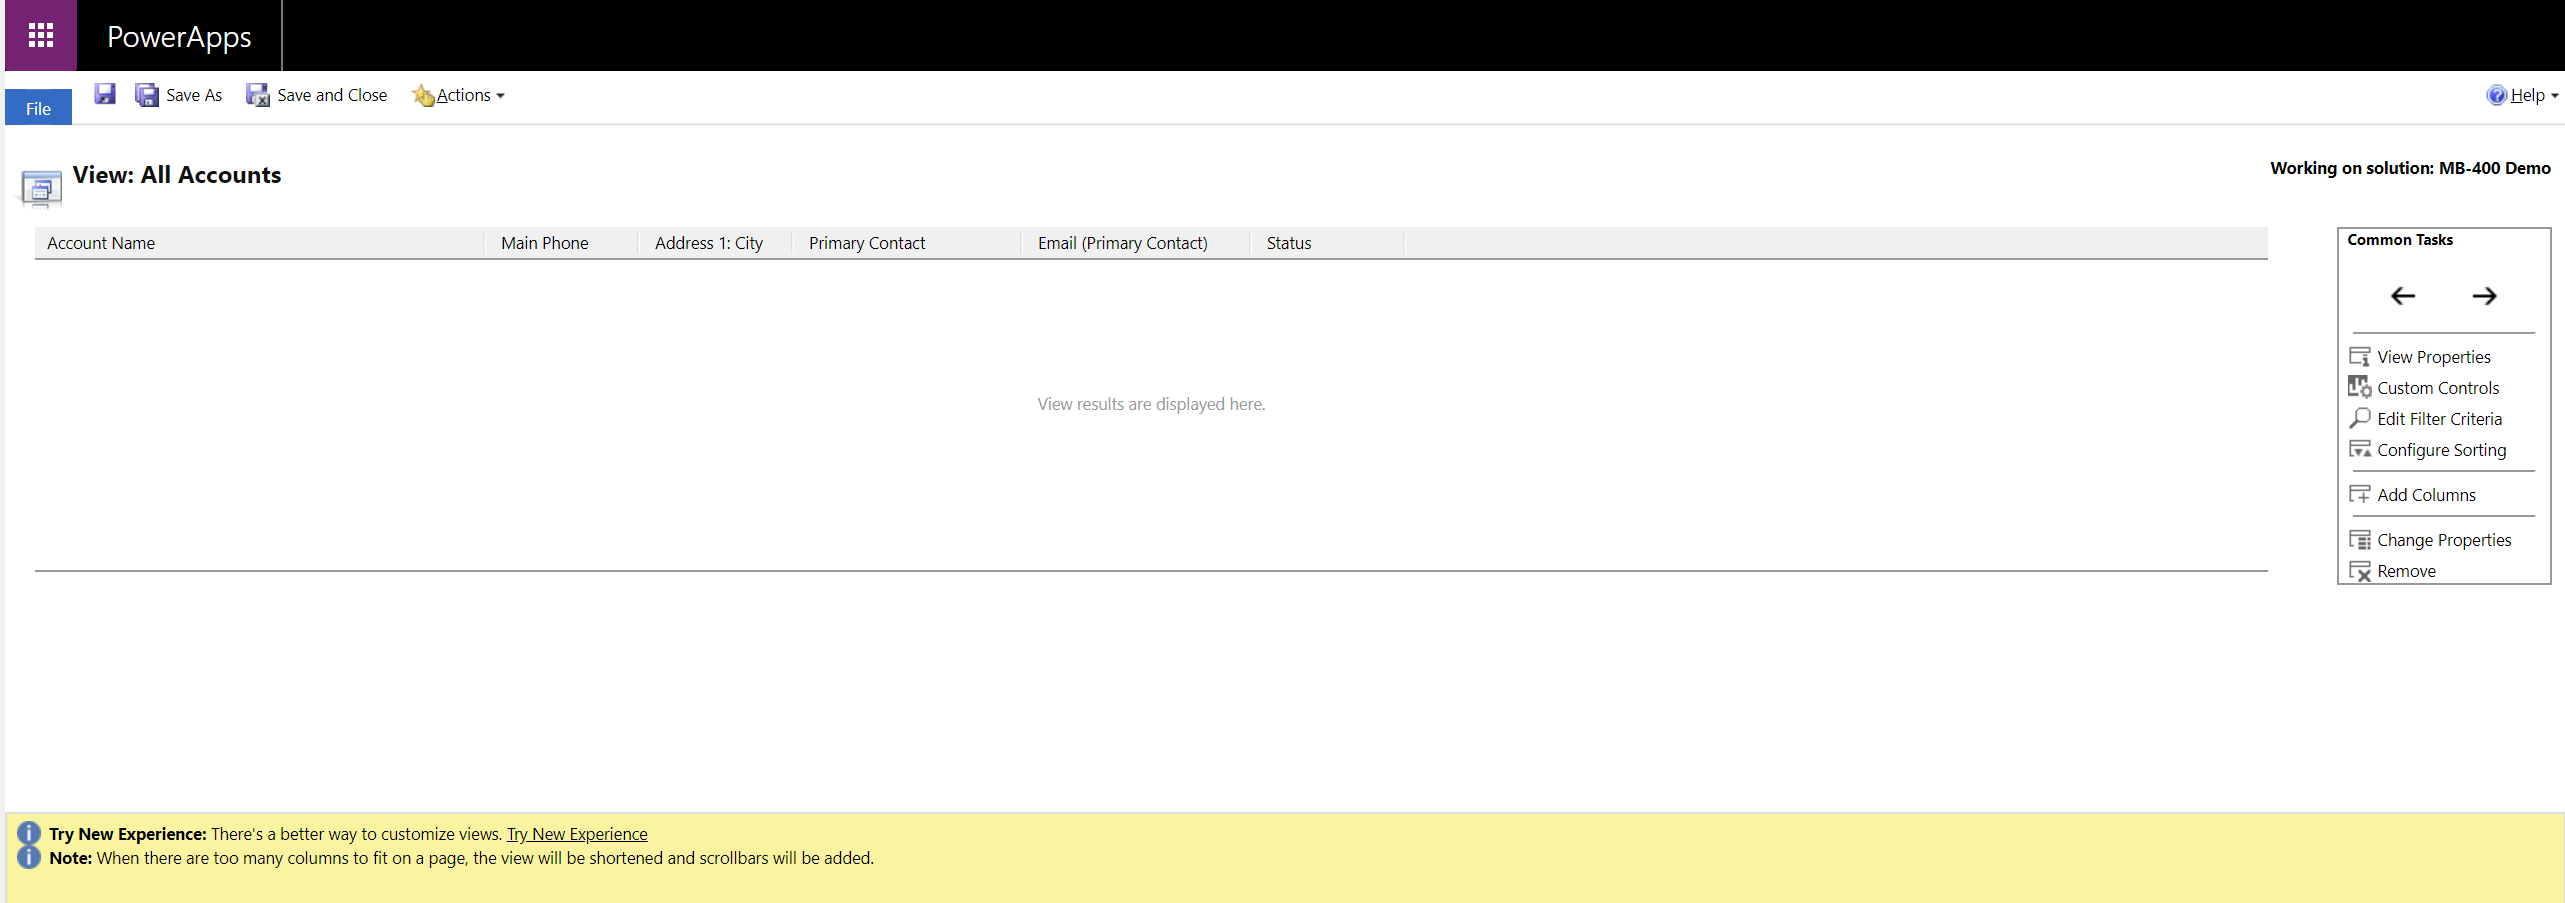
When compared with the Form editing experience, the potential usage cases for the classic view editor are, at the time of writing this post, limited. Namely, you will only want to use it when adding on custom icons to a views column properties, via a Web Resource or when adding a PCF control to a view. These, incidentally, will probably be only situations where a developer needs to interact with and understand views. Some restrictions also exist within the classic editor. For example, you can only specify up to two Sort Order rules within the classic view editor. Therefore, there is no good reason not to use the new view designer wherever possible and, similar to forms, expect that all missing functionality to be eventually migrated across into the new view designer.
The subject of views typically covers an entire module as part of a customisation course, so it’s impossible to discuss them in-depth when it comes to this exam. I would recommend thoroughly reading through all of the Microsoft Docs articles on the subject of views and, in particular, familiarise yourself with the two specific developer scenarios mentioned in the previous paragraph.
Dashboards & Charts
The final piece of the model-driven app puzzle - and perhaps most important aspect, from a senior business users perspective - is bundling together additional visualisations and aggregate information into a single layer, ideally quickly accessible from within the model-driven app itself. We’ve already seen how to use views to assist in this regard - by presenting a tabular list of data, often sorted and filtered accordingly - but these only form a small part of the overall picture. Extending further from this, firstly, is the concept of charts, followed not long after by dashboards.
Charts
Charts allow customisers to quickly define a range of standard visualisations that can then be bound to any entity view within the application. Set at an entity level and accessible from within the new Power Apps centre, they are created in the classic interface, as indicated below:
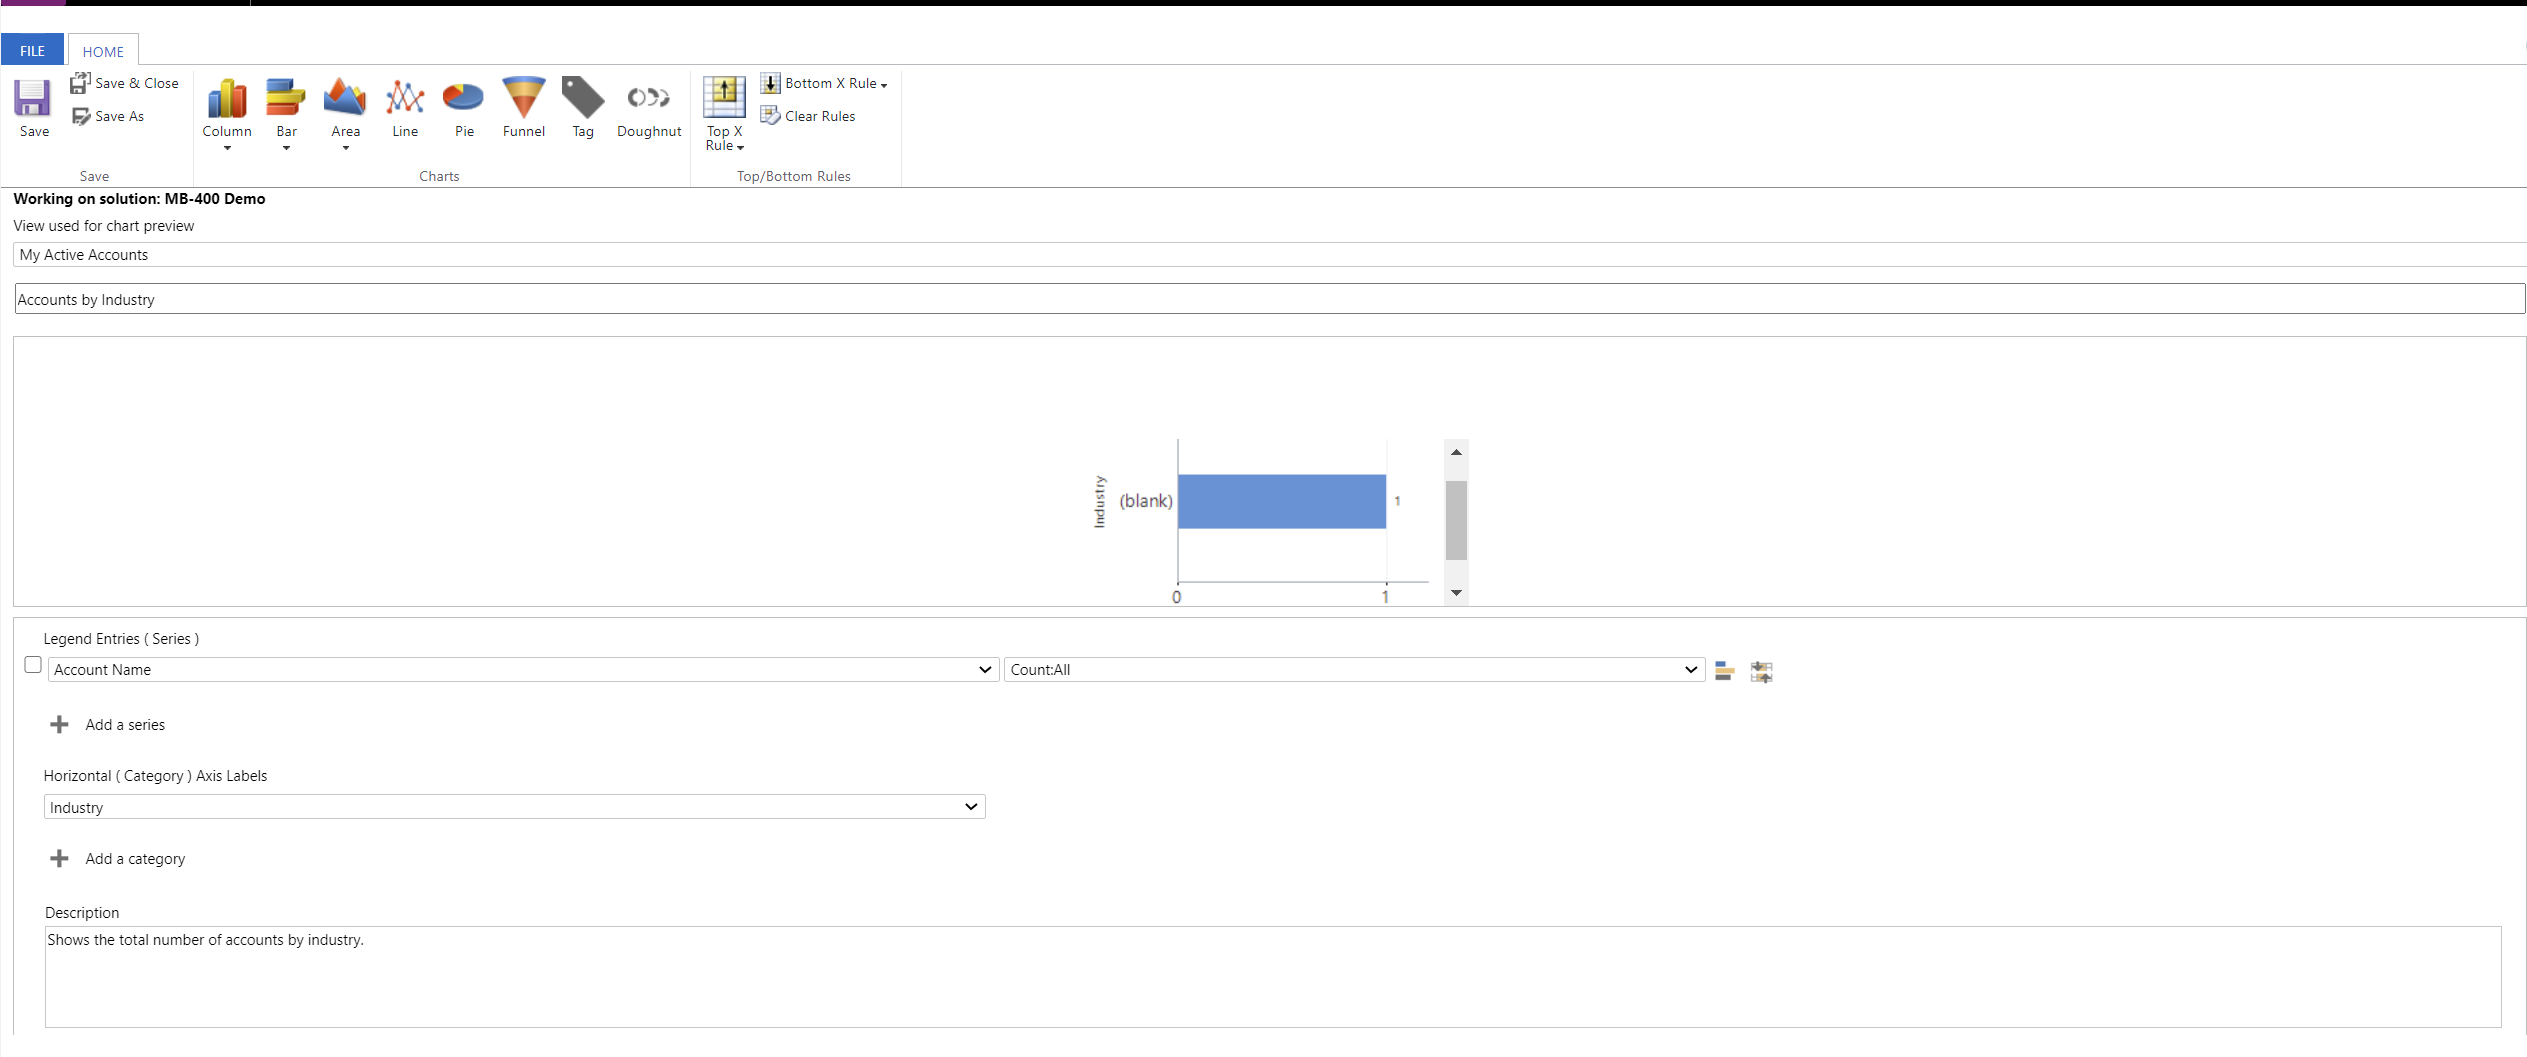
In this example, the out of the box Account by Industry chart is displayed, which renders a simple Bar chart, that counts up all Account records in the system, grouped by Industry.
As customisers, we can create the following chart types for a model-driven app:
- Column
- Standard
- Stacked
- 100% Stacked
- Bar:
- Standard
- Stacked
- 100% Stacked
- Area:
- Standard
- Stacked
- 100% Stacked
- Line
- Pie
- Funnel
- Tag
- Doughnut
Once you’ve decided on the type of chart to use, it will then be necessary to define:
- Legend Entries (Series): As part of this, you will also need to define the aggregation type to use for the data. The following aggregation options are available:
- Avg
- Count: All
- Count:Non-empty
- Max
- Min
- Sum
- Horizontal (Category) Axis Labels
It is possible to specify multiple series/categories, depending on your requirements.
In most cases, pretty much all of the standard entities support charts, but it is worth reviewing the precise list of compatible entities before deciding whether to use them or not.
Once you’ve created a chart, it can be added onto a dashboard (discussed shortly) or rendered alongside an existing Public View, via the Show Chart button:

Also, for situations where you are unable to get the chart rendering or displaying precisely how you want to, developers can choose to export the underlying XML definition for a Chart and modify it accordingly. This option opens up a range of additional options, allowing you to tweak how the Chart ultimately renders within the application. Your best source for discovering the types of things achievable via this method is by consulting Ulrik “The CRM Chart Guy” Carlsson’s blog, which is an absolute treasure trove on this subject.
Dashboards
Having lots of brilliant views and charts within your model-driven app is all well and good, but useless if these remain inaccessible or diffuse from each other. For this reason, dashboards are incredibly useful and, from a model-driven app perspective, the critical thing that is presented to users when first opening a model-driven app. They provide a blank canvas, allowing customisers to bring together the components mentioned so far, alongside others, in a highly focused view. There are two types of dashboards we can create - the first, from an Entity itself, are called Interactive experience dashboards, and you can see the editor for this type of dashboard below:
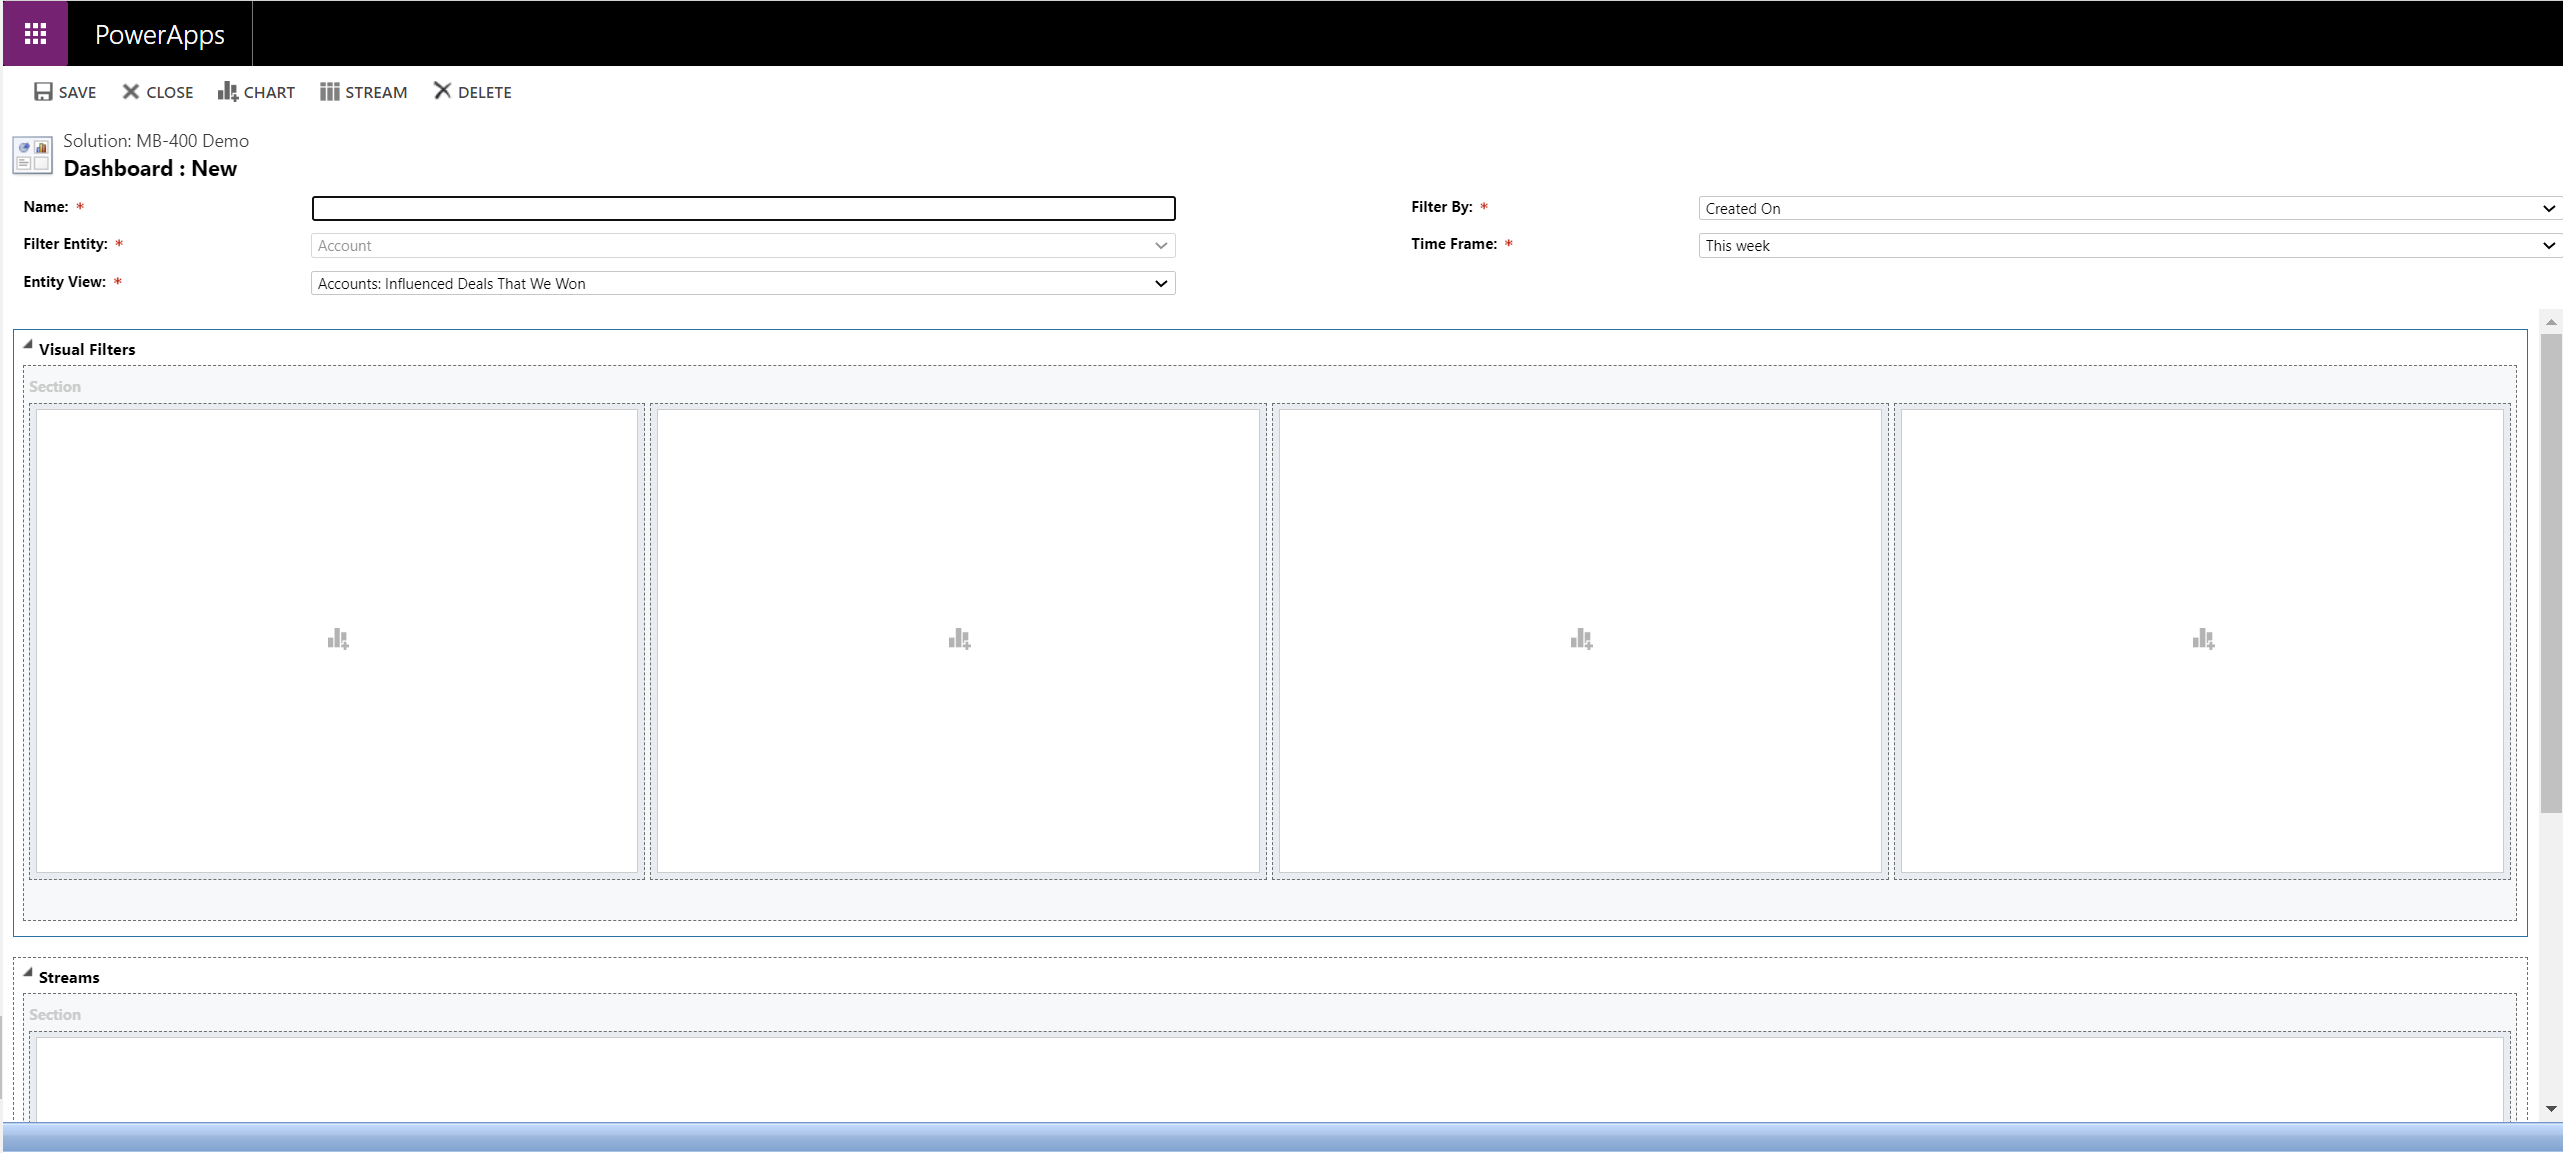
For these types of dashboards, you can add on both Charts and Streams AKA views. Also, you can define the underlying entity view they are bound to and even the period on which to return records. In short, Microsoft has designed them to provide a more immediate view of data that may require priority action or review. A good usage case for interactive experience dashboards includes a support desk or emergency contact centre dealing with incoming caseloads. As a component that is tied strictly to a single entity, it is not possible to bring in charts or views from any related entity into these types of dashboards.
It is also possible to create standard dashboards untied to a specific entity. Dashboards of this type have a few more options available to them, as the editor for them attests to:
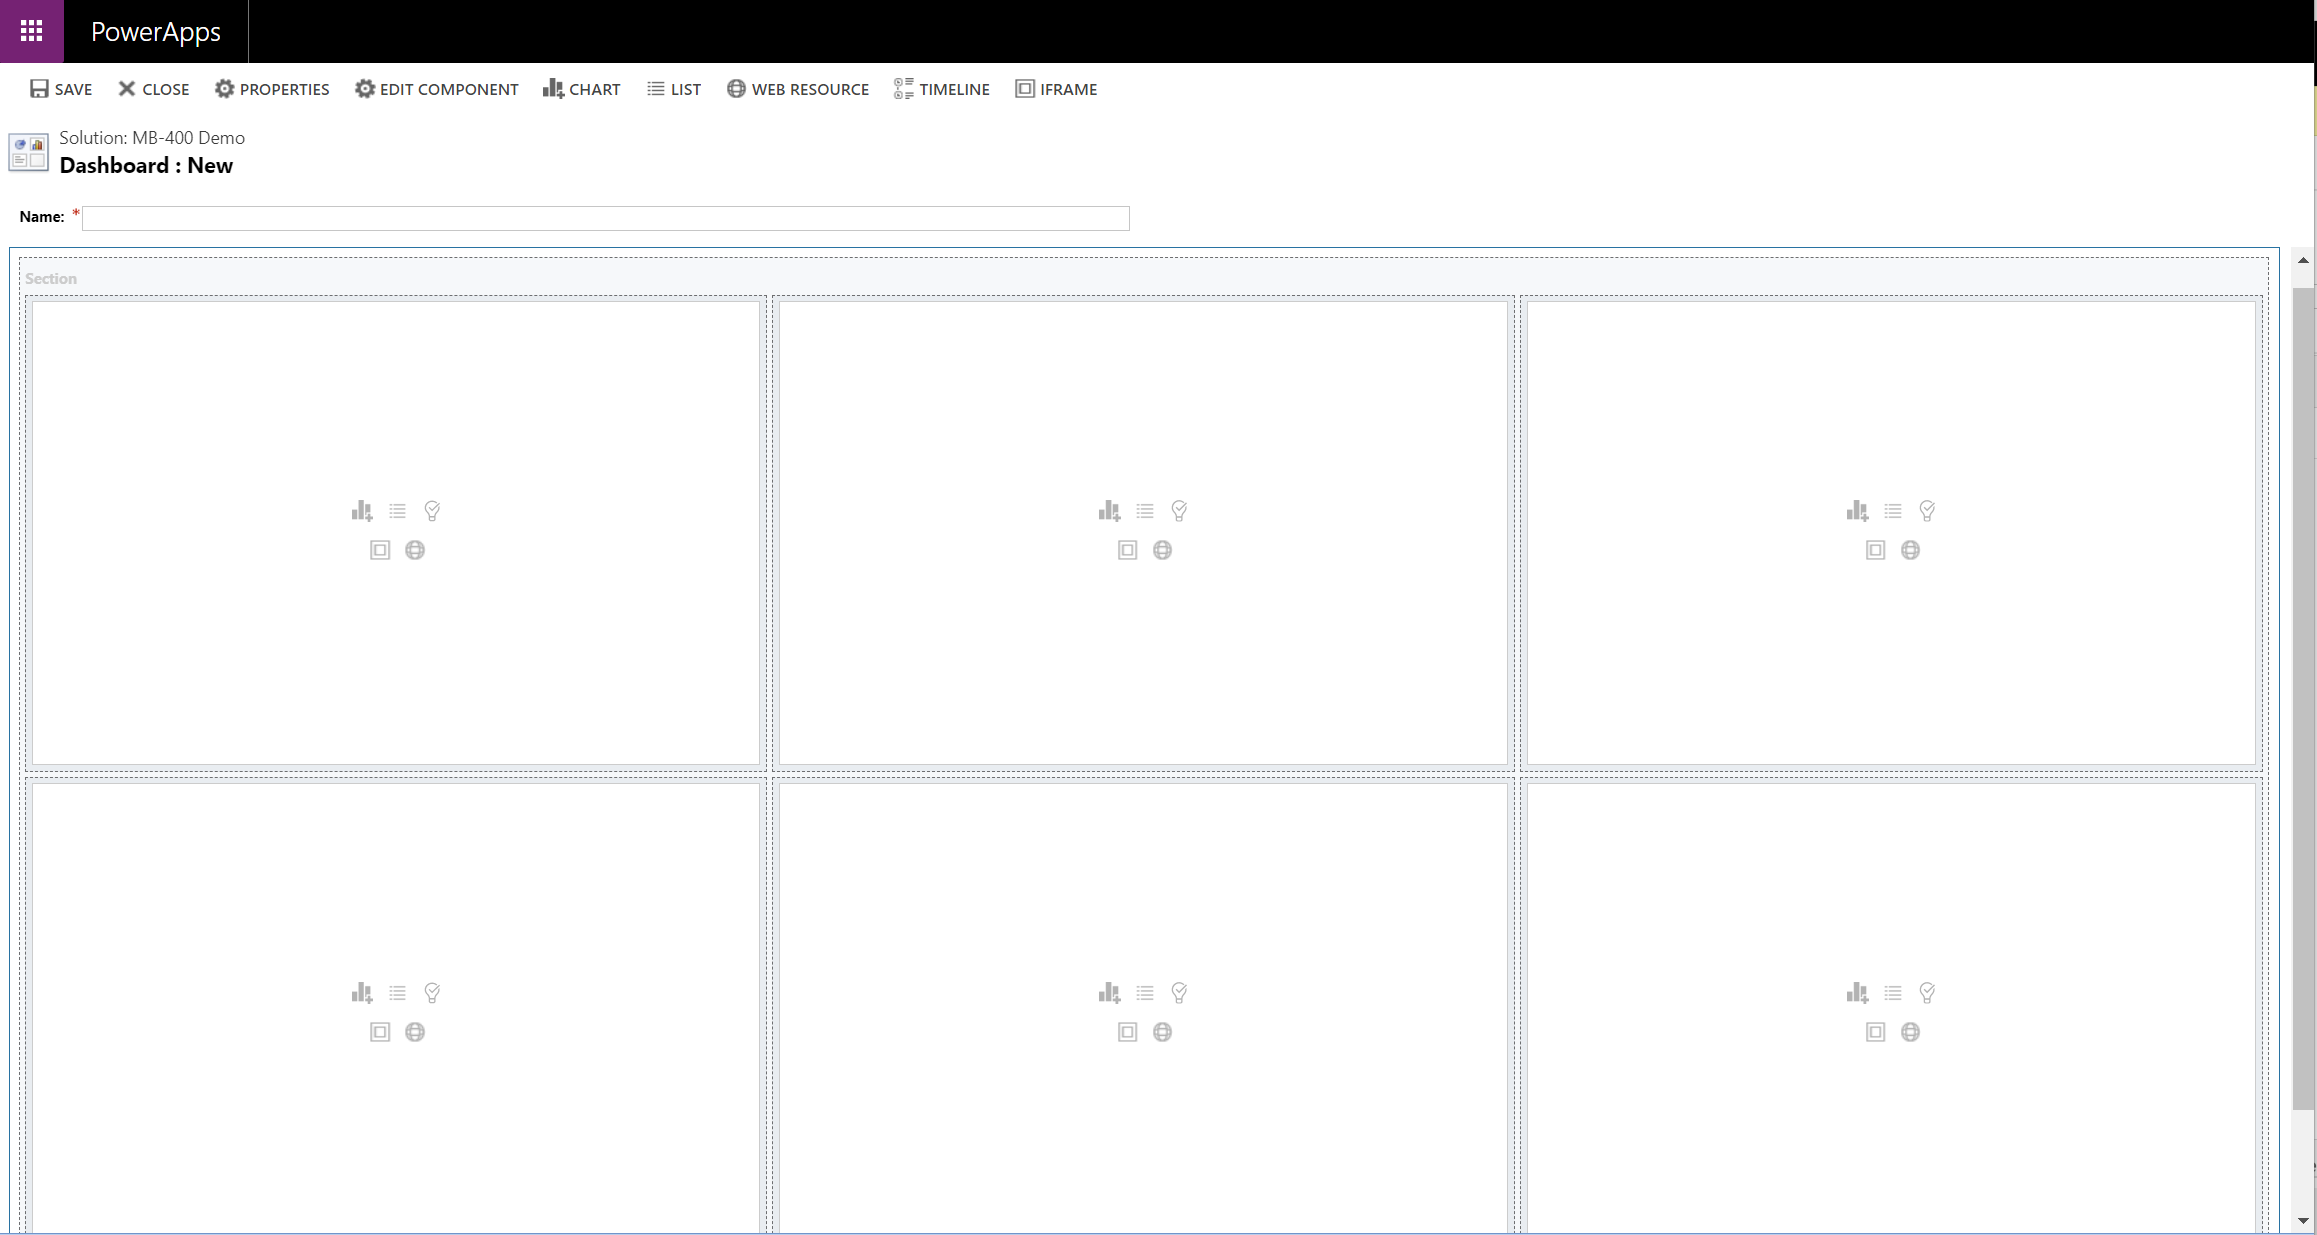
As well as supporting views and charts, we can also add the following components to these types of dashboards:
- Web Resources: Any Web Resource deployed to the system can be rendered from within a dashboard.
- Timelines: This is a custom control type, available only within the UI, that lets you see a complete history of previous activities or other notable information relating to customer or contact. You can find out more about them on the Microsoft Docs website.
- IFrame: You can embed custom content from any web page into a dashboard via this control type.
In most cases, standard dashboards will be your preferred choice, given that they support far more options and do not face the same restrictions from a timeframe perspective.
Developers will typically work with dashboards whenever there is a need to pull in content from external sources, using the two-component types referenced earlier - Web Resources or IFrames. Unlike charts, it is not possible to export the definition of a dashboard and modify its visual appearance; therefore, in most cases, you will strictly work with them from within the web interface, and then bundle them up within a solution or model-driven app.
Demo: Creating a Model-Driven App, Form, View, Chart & Dashboard
The best way of seeing how all these components fit together is by building an app from scratch. Take a look at the below video, which will take you through all steps from start to finish:
There are a lot of powerful capabilities within model-driven apps, that can often negate the need to develop alternative solutions. Having a good awareness of these topics will help Dynamics 365 and Common Data Service developers in building an effective solution quickly, without necessarily resorting to code. Tune in next week, when we’ll be taking a closer look at the other type of Power Apps - canvas apps.